Investigating Gender Price Differences in UK Retail Products
Products marketed to women are often said to cost more than comparable products for men.
This project tests that claim across 12,800 supermarket products from three UK retailers,
first building a machine learning classifier to identify gendered products from text and
color features, then running a series of regressions that progressively control for
product category, store, and product characteristics.
Products12,832
RetailersTesco, Morrisons, ASDA
CategoriesPersonal care & hygiene
ProgrammeMPA Data Science, LSE
Background
Concepts & Research Design
The "pink tax" refers to the observation that consumer products marketed
toward women are priced higher than comparable products aimed at men. The term is widely
used in media and policy debates, but the empirical evidence is mixed. Some studies find
price premiums on specific items (deodorants, lotions), while others conclude that apparent
gaps largely reflect differences in product composition rather than discriminatory pricing.
Gonzalez Guittar et al. (2022) studied over 3,000 products and found selective premiums,
though men paid more for shaving products. Moshary et al. (2023), using Nielsen scanner
data with product ingredient controls, concluded that price gaps reflect product
differentiation rather than a systematic "tax."
Gender classification is the first challenge. Many products signal gender
through color choices, language, and brand names rather than stating it explicitly. With
roughly 21,000 products in this dataset, manual labeling is impractical. This project
automates the task using a supervised classifier trained on products with explicit gender
terms (e.g. "for women", "men's"), then applies it to label the remaining products.
TF-IDF (term frequency-inverse document frequency) converts product text
into numerical vectors by measuring how distinctive each word is within the dataset. Words
that appear frequently in one product but rarely across all products receive higher weights.
This allows the classifier to learn which terms are associated with gendered products.
K-means clustering, used here for color extraction, groups pixel RGB values
from product images into clusters to identify the most prevalent colors in each image.
Research Question
Do products marketed to women cost more than comparable products for men in UK
supermarkets? And if so, does the gap persist after controlling for product category?
The central finding is that apparent price differences between gendered products are driven
by category composition, not within-category discrimination. Female products are concentrated
in lower-priced categories (personal care, period products), while male products span a wider
range including premium grooming items. Once product category is accounted for, the price gap
becomes statistically insignificant.
Analytical Approach
The analysis proceeds in two stages. First, supervised classification
labels products by target gender using text features (TF-IDF vectors from product
descriptions and category breadcrumbs), color features (dominant colors extracted from
product images via K-means), and metadata (store, price). Five classifiers are compared,
from logistic regression to histogram gradient boosting. Second, OLS and quantile
regressions with progressively added controls (store fixed effects, category fixed
effects, description TF-IDF) estimate the price differential between female and male
products. The key test is whether the female coefficient remains significant after
controlling for product category.
Data
Sources & Preparation
The dataset contains 21,436 products scraped from Tesco, Morrisons, and ASDA. Categories
unlikely to be gendered (food, electronics, pet supplies, cleaning products) were excluded,
leaving 12,832 products in categories such as personal care, cosmetics, and toiletries.
Training Labels
Two sources: (1) explicit gender terms extracted via regex from product text
("for women", "men's", etc.), yielding 1,075 female and 844 male products;
(2) 259 products with independent human-coded labels from a separate validation
exercise. The training set was balanced to 844 samples per class (female, male,
neutral), producing 2,532 training observations split 75/25 into training
(1,905) and test (639) sets.
Feature Construction
329 features total. Text: TF-IDF vectors from product descriptions
(150 features) and category breadcrumbs (80 features). Color:
dominant colors extracted from product images using K-means, mapped to 31 named
colors, producing 93 binary features (3 color slots × 31 colors).
Metadata: store ID, price, and unit price (6 features).
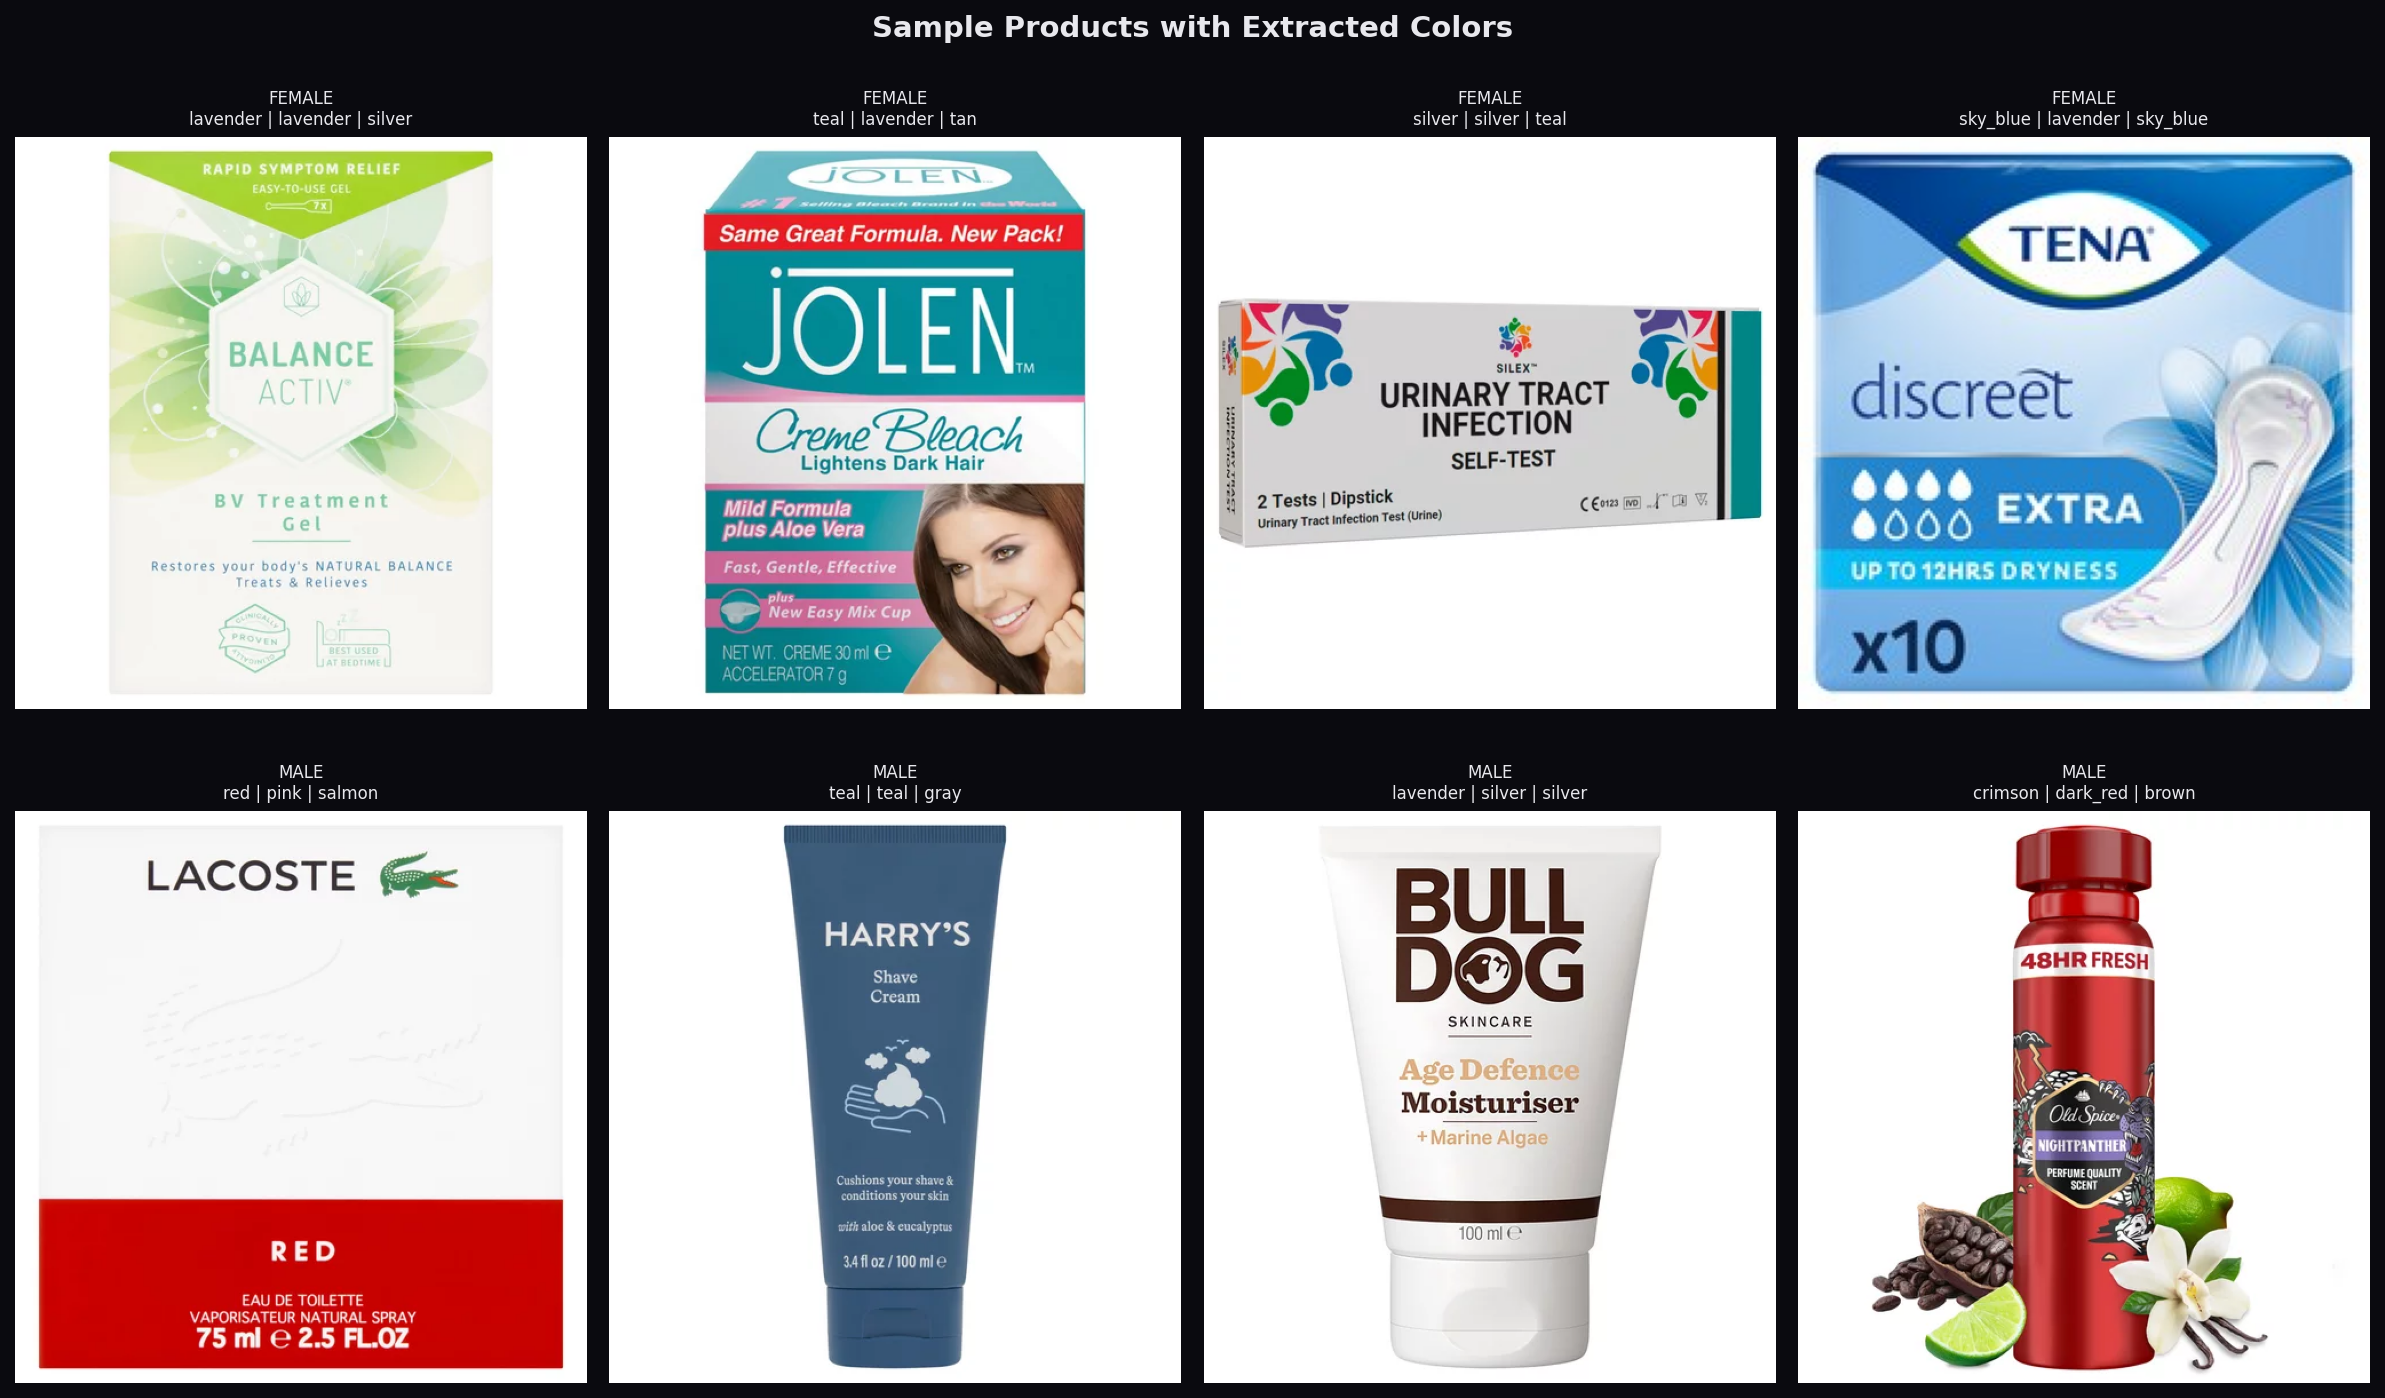
Color Extraction
For products with accessible image URLs, the three most dominant colors were extracted
using K-means clustering on pixel RGB values, then matched to the nearest named color
from a 31-color palette. Color data was successfully extracted for 5,619 products, all
from Morrisons. Tesco and ASDA image URLs had expired at the time of extraction, yielding
a 0% success rate across those domains. This coverage limitation means color-based
findings should be interpreted with caution.
Sample products with extracted dominant colors. Some extractions are noisy: the Lacoste cologne
is labeled male but extracted colors include pink/salmon from the background.
Part I
Gender Classification
The classification task assigns each product to one of three classes: female, male,
or neutral. Five classifiers were tested on a 75/25 train-test split. Performance is
measured on the held-out test set (639 samples). The models range from simple linear
classifiers (logistic regression with L1 or L2 regularization) to ensemble methods
(gradient boosting, random forest) that combine many decision trees to capture
nonlinear relationships and handle sparse or missing features.
Model Comparison
Model
Accuracy
F1 (Weighted)
Histogram Gradient Boosting
79.3%
0.793
SVM (RBF kernel)
73.1%
0.729
Logistic Regression (L2)
72.9%
0.730
Random Forest
72.3%
0.722
Logistic Regression (L1)
64.9%
0.646
Histogram gradient boosting performed best, likely because it handles sparse features
and missing values (many products lack color data) natively, without requiring
imputation. Per-class precision and recall range from 77% to 82% across all three
classes, with the neutral class achieving the highest recall at 86%. The model is
conservative: it tends to classify uncertain products as neutral, leading to
under-classification of gendered products rather than false positives.
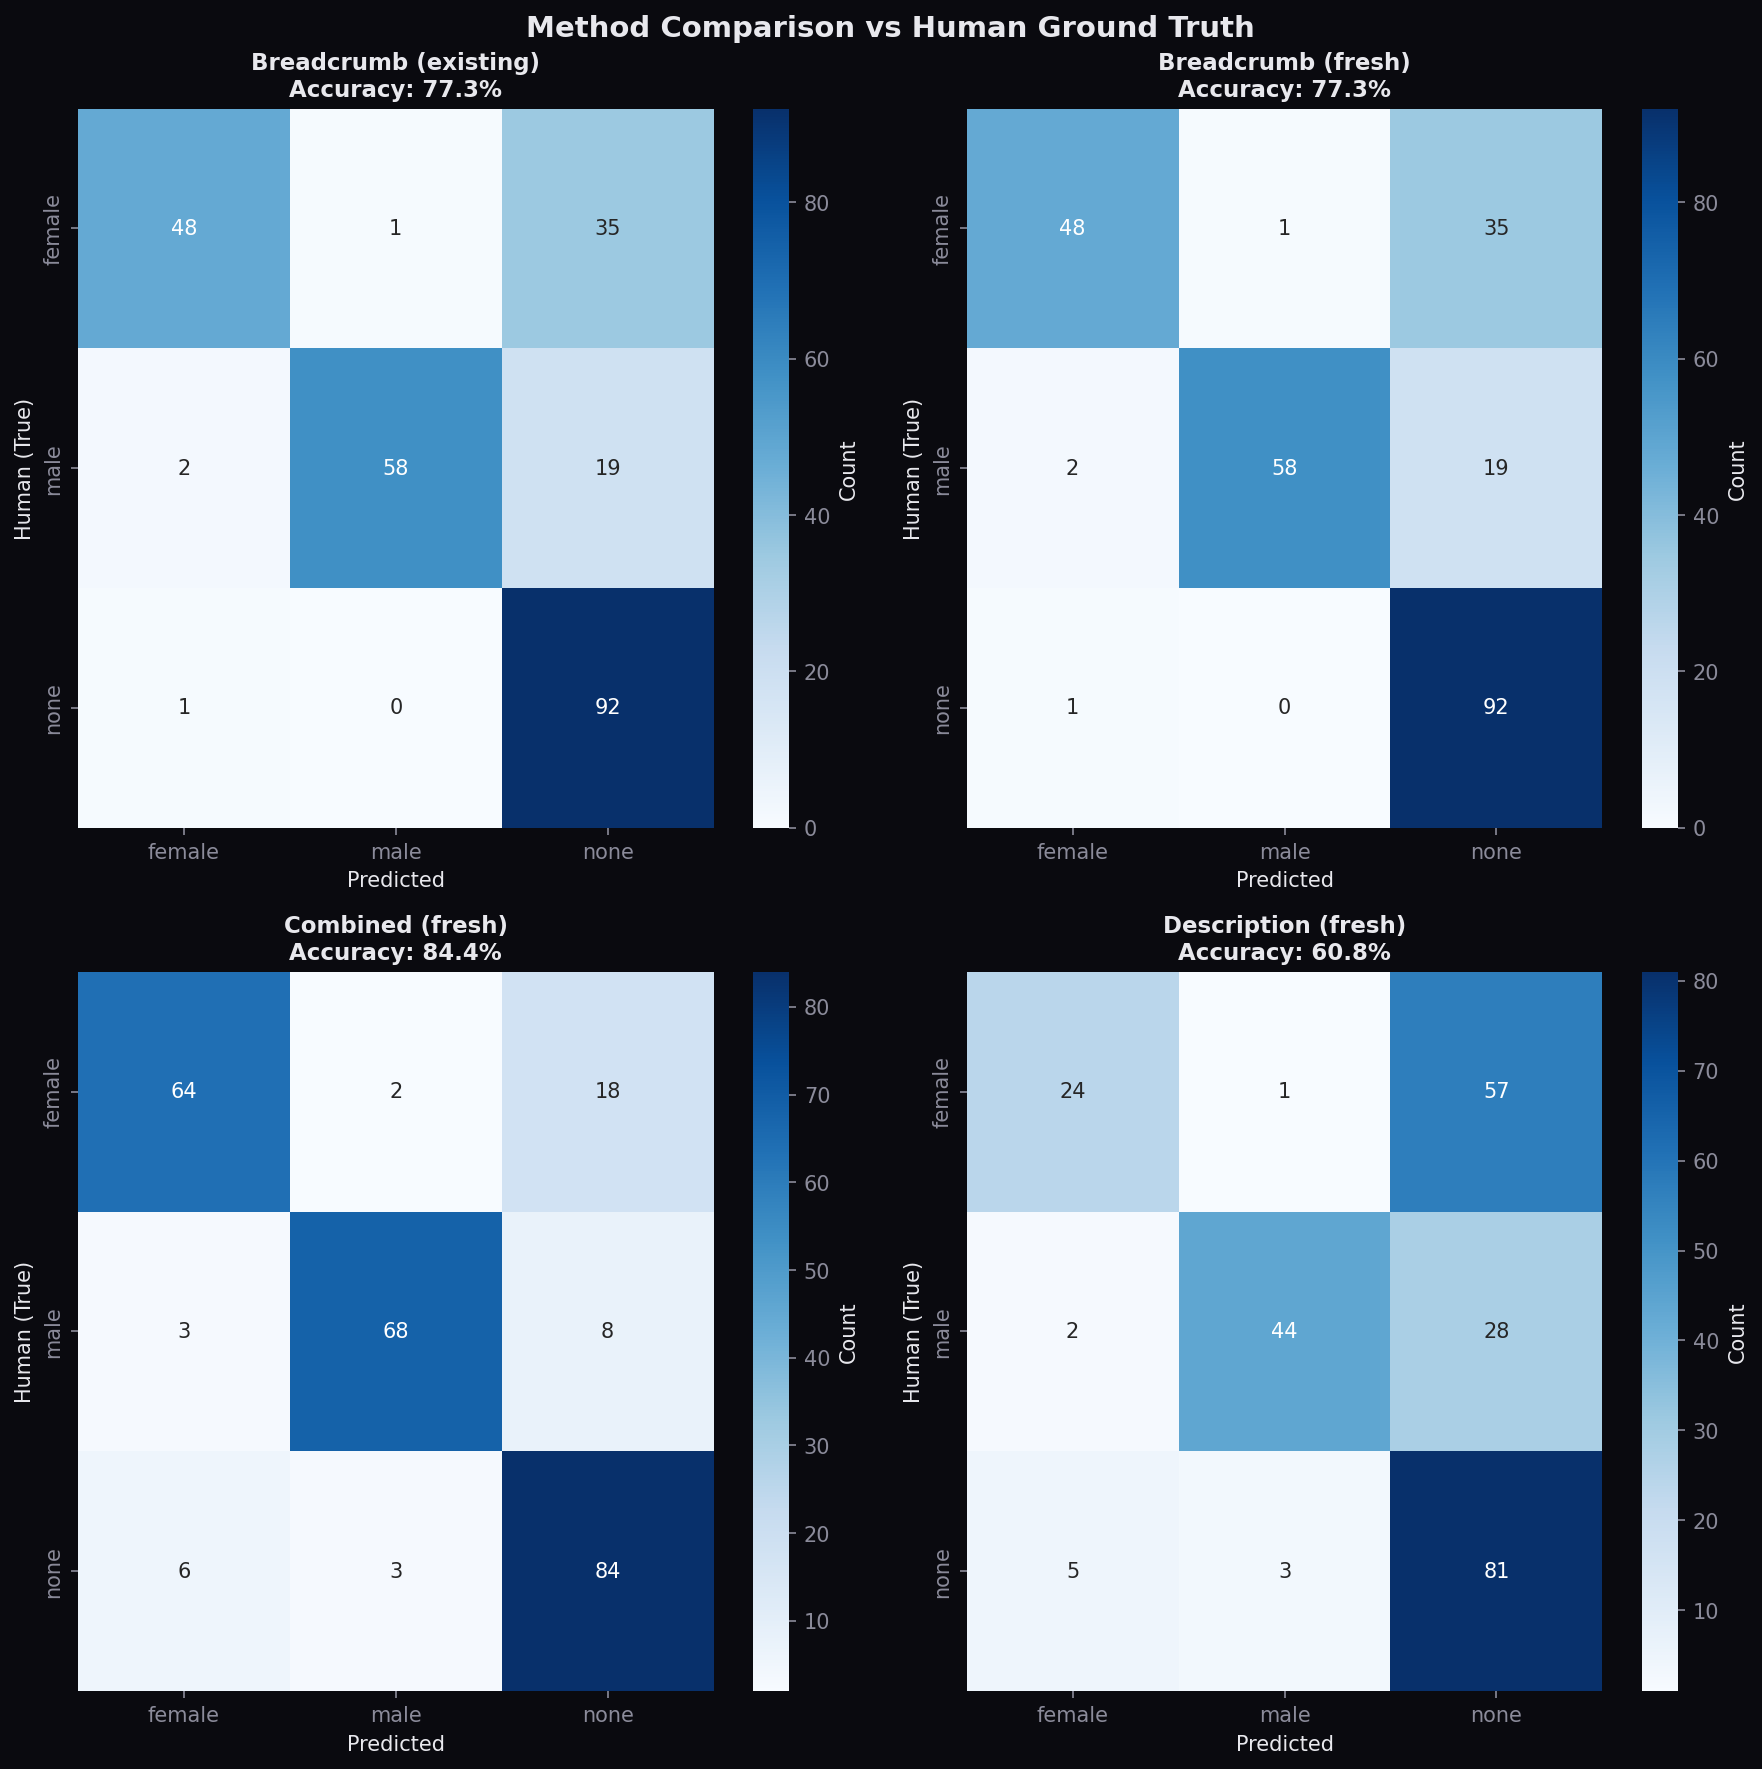
Human Validation
The test set above uses labels derived from explicit text patterns, which may not
reflect how humans would categorize products. A stricter validation uses 200 products
with independent human labels. On this set, the best model achieves 70% accuracy.
The drop from 79% to 70% is expected: human coders pick up on subtler gendered
marketing cues (brand positioning, imagery, packaging design) that text and color
features miss.
Agreement with human coders across different feature sets. The model under-classifies gendered products rather than over-classifying neutral ones.
Feature Importance
Feature importance values from the histogram gradient boosting model indicate how
strongly each feature pushes the prediction toward a particular gender class.
Features are prefixed by source: "bc_" for category breadcrumb terms, "desc_" for
product description terms, and "feat_color1_" for the dominant extracted color.
Female Predictors
bc_removal: +1.05
bc_period: +0.94
bc_intimate: +0.88
desc_protection: +0.70
bc_products: +0.67
feat_color1_lavender: +0.33
Male Predictors
bc_toiletries: +1.86
desc_lynx: +1.04
bc_gel: +0.87
bc_razors: +0.82
bc_blades: +0.67
feat_color1_black: +0.56
Neutral Predictors
bc_accessories: +0.78
bc_conditioner: +0.66
bc_marketplace: +0.65
bc_toothpaste: +0.60
bc_care: +0.52
bc_baby: +0.48
Brand names are strong predictors: "Lynx" for male is among the top features.
Category breadcrumbs also encode gender: UK retailers place "toiletries" in
male-coded sections and "removal" (hair removal) in female-coded sections, even
for functionally similar products. Color features appear lower in the ranking but
still contribute: lavender predicts female, black predicts male.
Color Patterns
The charts below show color distributions in explicitly gendered products alongside
LASSO coefficients indicating which colors predict each gender class. LASSO
(L1-regularized logistic regression) shrinks irrelevant feature weights to zero,
isolating the colors that carry the strongest classification signal.
Color frequency in products with explicit gender labels. Sample sizes are small (n=32 each).
LASSO coefficients from a binary female/male classifier. Positive values predict female;
negative values predict male.
The patterns match expectations: pinks, purples, and lavender are associated with
female products; black, brown, and navy with male products. Some results are less
intuitive: tan has a strong female coefficient, likely driven by foundation and
cosmetics packaging. These associations reflect marketing conventions rather than
any inherent property of the colors.
Marginal Contribution of Color Features
To isolate the contribution of color features, the same L1 logistic regression
was trained with and without the 93 color-based features. The comparison measures
the marginal gain from adding color information on top of text and metadata inputs.
Configuration
Accuracy
F1
With colors
64.9%
0.646
Without colors
62.8%
0.622
Difference
+2.2pp
+0.024
The improvement is modest at the aggregate level. Color features are most useful when
text signals are weak or absent, such as for products with minimal descriptions.
Since color data is available only for Morrisons (5,619 of 12,832 products), the
contribution is likely underestimated in the full-sample evaluation.
Full Dataset Predictions
Applying the best classifier to all 12,832 filtered products produces the following
distribution. Beyond the explicitly labeled products, the model identifies 533 implicitly
female and 278 implicitly male products at above 50% confidence: items that lack explicit
gender terms but whose text and color patterns suggest gendered marketing.
Predicted Class
Count
Percentage
Neutral
9,185
71.6%
Female
2,255
17.6%
Male
1,392
10.8%
The high neutral proportion reflects both the genuine prevalence of ungendered products
in the dataset and the model's conservative classification tendency. Some products
labeled neutral likely carry subtle gendered marketing that the text-and-color feature
set cannot detect.
Part II
Estimating the Pink Tax
With gender labels assigned, the second stage estimates the price differential
between female- and male-targeted products. All regressions use log-transformed
prices as the dependent variable, so coefficients approximate percentage differences
(a coefficient of -0.10 corresponds to roughly a 10% price gap). Standard errors are
heteroskedasticity-robust (HC1), which accounts for unequal variance across
observations and guards against misleading confidence intervals.
The analytical strategy is to add controls progressively. If the female coefficient
becomes insignificant after controlling for product category, the implication is that
the raw price gap reflects composition effects (women's and men's products fall into
different product types with different baseline prices) rather than within-category
pricing discrimination.
Raw Price Comparison
Among the 1,919 explicitly gendered products (1,075 female, 844 male), female
products have a lower mean price (£7.03 vs. £8.15) and lower median
(£4.00 vs. £4.50). This is the opposite of what a simple "pink tax"
narrative would predict.
Female Mean£7.03
Male Mean£8.15
Raw Gap−9.3%
Gendered Products1,919
Price distributions for female and male products. Log prices (top right) show
overlapping distributions with female products shifted slightly left.
Progressive Controls
Regression Results
The table below shows how the female price coefficient changes as controls are
added. Each row introduces a layer of controls to isolate the effect of gender
on price. "Fixed effects" (FE) are dummy variables for each store or category,
allowing the model to compare products within the same store or product type
rather than across them.
Specification
Controls
% Gap
95% CI
p-value
R²
(1) Raw gap
None
−9.3%
[−16.3, −1.7]
0.018**
0.003
(2) + Store FE
Store
−9.8%
[−16.8, −2.3]
0.012**
0.006
(3) + Category FE
Store + Category
+8.4%
[−8.3, +28.0]
0.345
0.672
(4) + Description
Store + Cat + TF-IDF
+3.7%
[−9.1, +18.4]
0.587
0.738
(5) Unit price
Store + Category
+0.7%
[−11.8, +15.0]
0.922
0.854
** p < 0.05. All specifications use log(price) as the dependent variable with HC1
robust standard errors. N = 1,919 for specs (1)-(2); 1,374 for specs (3)-(4);
743 for spec (5). Spec (5) uses log(unit price) as the dependent variable.
The R² jump from 0.006 to 0.672 when adding category fixed effects is the key
result. Product category explains the vast majority of price variation. The raw
negative gap arises because female products are concentrated in lower-priced
categories (personal care, period products), while male products span a wider
range including grooming sets and premium razors. Within the same category, there
is no statistically detectable difference.
Female price coefficient with 95% confidence intervals. The gap is significantly negative
without controls, then shifts to a small positive but insignificant estimate with category controls.
Variance explained by each specification. Category controls account for the largest share of price variation.
Gendered vs. Ungendered Products
A three-way comparison using all 12,832 products (with ungendered products as the
reference group) shows that both gendered categories are cheaper than ungendered
products, with female products especially so. Female products are 16.4% cheaper than
ungendered ones (p < 0.001), while male products are 2.9% cheaper (not significant).
This suggests gendered products as a whole occupy lower price tiers than the broader
product mix, rather than female-targeted products being marked up.
Price distributions across all three gender groups. Ungendered products span a wider and higher price range.
Within-Category Analysis
Only 11 product categories contain at least 3 female and 3 male products, limiting
the scope of within-category comparisons. For these categories, the median price gap
is +7.4% (female more expensive) and the weighted mean is +26.2%, though this average
is heavily influenced by outlier categories with very small sample sizes. Most individual
gaps are not statistically significant, based on bootstrap confidence intervals (1,000
resamples).
Category
F
M
Gap
Significant
Toiletries > Incontinence
12
3
+259%
Yes
Toiletries > Gifting
3
9
+30%
No
Marketplace > Greeting Cards
11
9
+25%
Yes
Toiletries > Incontinence (sub)
5
3
+16%
No
Greeting Cards > Birthday
22
11
+10%
No
Greeting Cards > Other
18
8
+2%
No
Baby > Nappies
3
3
0%
No
Health > Medicines
11
4
−35%
No
Health & Beauty > Shower
3
10
−55%
Yes
Significance based on 1,000-draw bootstrap 95% confidence intervals.
Interpreting the Within-Category Results
The +259% outlier in incontinence products is driven by only 3 male comparison
products, making it unreliable. The greeting cards category shows a more consistent
pattern (+10-25% across sub-categories, one significant), though this likely reflects
product differentiation (birthday cards for women may include different materials or
designs) rather than identical items at different prices. The shower category shows
the reverse: male products are more expensive, driven by premium grooming brands.
The direction and magnitude of the gap depends entirely on the product category.
Each point is a product category. Points above the 45-degree line indicate a female premium; below indicates a male premium.
Quantile Regression
OLS estimates the effect on the conditional mean, producing a single average price gap.
Quantile regression instead estimates the gap at different points of the price
distribution: the 10th percentile (budget products), the median, the 90th percentile
(premium products), and so on. This reveals whether any pricing asymmetry operates
differently at the cheap versus expensive ends of the market.
Quantile
Without Category Controls
With Category Controls
10th
−12.1% **
+43.0% ***
25th
0.0%
+25.0% ***
50th (median)
−10.0% **
0.0%
75th
0.0%
0.0%
90th
−20.0% ***
0.0%
** p < 0.05, *** p < 0.01. Percentage gaps computed as exp(coef) − 1.
N = 1,919 without category controls; 1,374 with category controls.
The "with controls" column includes store and category fixed effects (96 categories).
Quantile regression coefficients with 95% CIs. Left: store controls only. Right: store + category controls.
Floor-Price Effect
With category controls, the cheapest female products (10th and 25th percentiles) are
25-43% more expensive than the cheapest male equivalents within the same category
(p < 0.001), while the gap is zero at the median and above. This could indicate a
floor-price effect: budget female products start at a higher baseline, even if mid-range
and premium products are priced similarly. However, only 11 of 96 categories contain
enough gendered products for within-category comparison, and the number of observations
at the tails of these distributions is small, so these estimates should be treated
cautiously.
Variation by Store
Running the raw-gap regression separately by store reveals substantial heterogeneity.
Morrisons shows a large and significant female discount of 18.6% (p < 0.001), while
the other two stores show no significant gap. A female × store interaction model
confirms this: the Morrisons interaction is significant (p < 0.001) with a total
female effect of −50.6%, while the other stores show no significant interaction.
This suggests pricing patterns vary by retailer and that aggregating across stores
masks meaningful differences.
Left: female price premium by store (thick border = p < 0.05). Right: mean prices by gender and store.
Category Composition
Female products are concentrated in period products, hair removal, and intimate care.
Male products cluster in toiletries, deodorants, razors, and skincare. These categories
have different baseline price levels, which is the primary driver of the raw price gap.
The composition effect explains why the female coefficient flips sign once category
fixed effects are introduced.
Top product categories by gender. Female products are concentrated in fewer, lower-priced categories.
Synthesis
Conclusions
The classification and regression results point to four main takeaways about gender-based
pricing in UK supermarkets.
01
No systematic pink tax at the aggregate level
Female products are 9-10% cheaper in raw comparisons, and the gap becomes
statistically insignificant (reversing sign to +3.7%) after controlling for
product category. The unit price regression shows essentially zero difference
(+0.7%, p = 0.92). This aligns with Moshary et al.'s conclusion that price
differences between gendered products are explained by product differentiation,
not discriminatory pricing.
02
Price differences are driven by category composition
The R² jump from 0.006 to 0.672 when adding category fixed effects is
the critical result. Female products are concentrated in lower-priced
categories (period products, hair removal, intimate care) while male products
span a wider price range. The raw gap reflects where gendered products sit
in the category hierarchy, not pricing discrimination within categories.
03
Within-category results are mixed and limited
Only 11 categories had enough gendered products for comparison. Greeting
cards show a small female premium; shower products show a male premium;
most categories lack sufficient sample sizes for meaningful inference. The
quantile regression suggests a possible floor-price effect for the cheapest
products, but the evidence is limited.
04
Gender segmentation, not pricing, is the real finding
The classifier identifies widespread gendered marketing: 28% of filtered
products are labeled female or male. The more substantive observation is
the extent to which retailers segment products by gender through branding,
shelf placement, and product descriptions, regardless of whether this
segmentation translates into price differences.
Limitations
Classification
Products are classified using explicit keyword matching and a trained classifier.
Both approaches miss implicitly gendered products: items marketed through color,
imagery, or brand positioning without explicit terms. The human-coded sample
(259 products) showed that keyword-based labels miss roughly 23% of gendered
products.
Category Granularity
Only 11 product categories had sufficient products of both genders for
within-category comparison. Finer-grained categories would improve comparability
but reduce sample sizes further.
Product Equivalence
The regression controls for category and description text, but does not account
for product quality, ingredients, or size beyond what unit price captures. A
"women's razor" and a "men's razor" in the same breadcrumb category may differ
in blade count, handle design, or packaging.
Data Coverage
Color features are available only for Morrisons (5,619 of 12,832). The data
covers three UK grocery retailers; results may not generalise to other product
categories (clothing, electronics) or other markets.
Methodological Notes
Data Processing
21,436 raw products from Tesco, Morrisons, ASDA. Filtered to 12,832 in
gendered-relevant categories. Gender labels via regex extraction (1,919
explicit) and human coding (259). Training balanced to 844 per class
(2,532 total), split 75/25. Color extraction via K-means on pixel RGB
values, matched to 31-color palette (5,619 products with color data).
Statistical Methods
Classification: 5 models (Logistic L1/L2, SVM-RBF, Random Forest,
HistGradientBoosting). Best: HistGB, F1 = 0.793, human agreement 70%.
Regression: OLS with log(price) DV, HC1 robust SE. 96 category FE.
Quantile regression at 5 quantiles. Within-category significance via
1,000-draw bootstrap 95% CIs. Features: 329 (150 desc TF-IDF + 80
breadcrumb TF-IDF + 93 color + 6 metadata).